Innovation via Education
As we’ve made mention in numerous past articles and media, it is our belief that those that are involved with the crypto industry and markets need to be better educated and inspired to help usher in a new era of general adoption and acceptance of crypto culturally.
In a continuation of this effort we present to our community more detailed information on the next type of trading indicator, the MACD.

The MACD Indicator
The MACD (Moving Average Convergence/Divergence) was originally developed by Gerald Appel, a stock market technician, in the late 1970s (Appel, Gerald. The Moving Average Convergence-Divergence Method. Great Neck, NY: Signalert, 1979). It is used to spot changes in the strength, direction, momentum, and duration of a trend in a stock’s price. There have been many other technical tools that have been developed since the MACD, but it has remained a favorite and useful tool by traders over the course of time.
The MACD is yet another attempt to solve the lagging problem of the moving average crossover. As has been noted with the simple moving average, and longer lengths, by the time you get a signal or crossover, the move may be almost over. To make them more sensitive to the current market, traders have developed exponential moving averages (EMA), which gives more weight to current prices.
The MACD also uses the EMA in its calculations, as it compares the difference between a fast period EMA and a slower period EMA, with the standard periods being 12 and 26.
The MACD consists of three components:
- MACD line — the difference between the 12 and 26 period exponential moving average (EMA). Subtract the longer EMA (26) from the shorter EMA (12)
- Signal line — the 9 day EMA of the MACD line
- Block histogram — the difference between the MACD and the signal line
MACD line: The MACD line is the 12-Period EMA minus the 26-period EMA. If the MACD line is positive and rising, the rate of change between the 12 day and the 26 day is increasing. This is a positive momentum and indicates a bullish period. If the MACD line is negative and falling, the short-term indicator is falling faster than the long-term and shows the market is going down.
Signal line: After the MACD line is determined, a 9-period EMA of the MACD line inserted as the trigger and it is called the MACD signal line. When the MACD line goes above the MACD signal line, this is a bullish signal. A move below the MACD signal line is a sell signal.
Example: USDCHF daily chart.
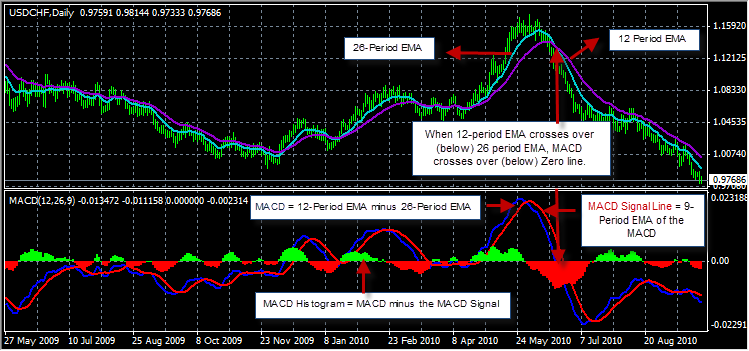
As you can see, when the 12-Period EMA crossed below the 26-Period EMA, the MACD crossed below the Zero Line. This could have been a nice entry for a long run downwards. A better entry can be found just prior, when the MACD (blue line) crossed below the MACD Signal Line (red line). The histogram illustrates this crossover by indicating a red histogram forming underneath the Zero line.
The default MT4 MACD indicator lacks the MACD line, and instead of showing the MACD line, it gives you a histogram of it.
MT4 MACD versus Classic MACD (MACD_ColorHist_Alert):
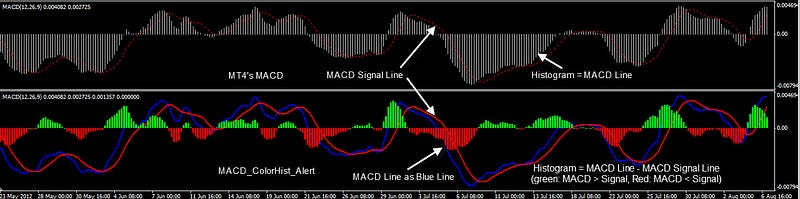
Critics of MT4 MACD: They argue that in excluding the MACD line as a line (and instead incorporating it as a histogram), one can no longer see the crossing of the MACD/Signal Line as clearly. Moreover, the MACD histogram in the classic sense would normally represent the difference between the MACD and Signal Line and thus display the underlying strength of the trend, and instead, it just shows the outline of the non-existent MACD Line, which is not as helpful.
Defenders of MT4 MACD: They argue that the MT4 MACD is cleaner looking, as traders do not care about the difference between the MACD/Signal lines nearly as much as the crossing of them, which can be seen just as well when the histogram (the MACD line) crosses over the Signal Line.
The MACD presents traders with three strategies:
Strategy #1: Crossing the 0 line
A move by the MACD line above the 0 line is a buy signal, while below is a sell signal. This is the same as the 12-period EMA crossing over the 26 period EMA.
Caution: In using the relatively shorter lengths of 12 and 26 combined with exponential calculation method, the strategy is going to be more responsive (less lag) than longer lengths using the simple moving average method, but at a serious price: because it is striving for less lag, it will encounter more noise.
It will often generate false signals within the noise and volatility of the market, particularly when the market enters its inevitable sideways action. Despite its noise problem, many MACD traders feel that this strategy still has too much lag, and so they prefer the second strategy, discussed below.
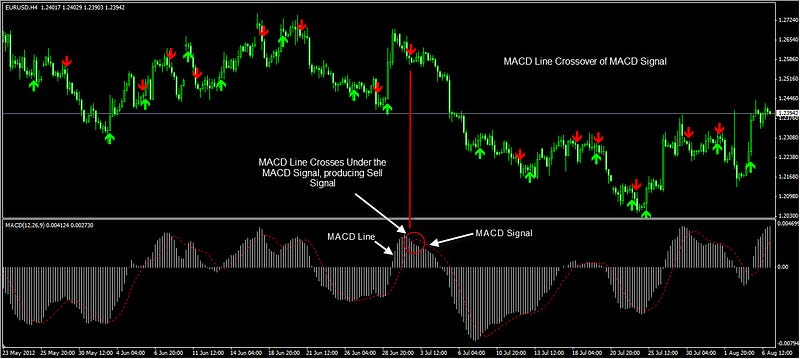
Strategy #2: MACD crossing the MACD Signal Line
When the MACD crosses over the MACD signal line, this is known as a bullish crossover, and is a buy signal. When the MACD crosses MACD signal line, this is known as a bearish crossover, and is a sell signal. Note that the MACD crossover of the MACD Signal Line significantly reduces the lag found in the 12–26 EMA crossover.
Caution: We already cautioned about how the 12–26 EMA crossover lengths have less lag but more noise than using higher lengths with SMA, and the above strategy strives to eliminate further the lag factor. It is a strategy for traders striving for the fastest response time to a trend change. Great for scalping — if used in conjunction with other entry conditions. Also, it can be nicely deployed as a trend filter for other strategies. But it is not a great strategy by itself.
It will generate far too many false signals as it tries to anticipate the slightest of trend changes within the noise and volatility of the market. These false signals will end up eroding any profit made from the signals taken on genuine trend changes.
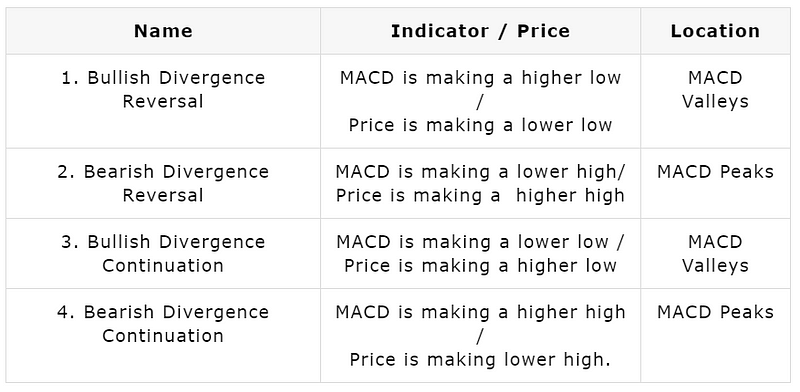
Strategy #3: The divergence between the MACD and price action.
Bullish Divergence occurs when the MACD is starting to turn up, making a higher low, but the underlying currency being analyzed is still making new lows. This Bullish divergence also occurs if the MACD is making a lower low, but the price is making a higher low. Sell signals occur when the opposite circumstances from those described above transpire.
Here is a simple table to define the different divergences:
The bullish (or bearish) divergences are not common and often takes some study to detect but they can be detected faster with custom indicators developed below.
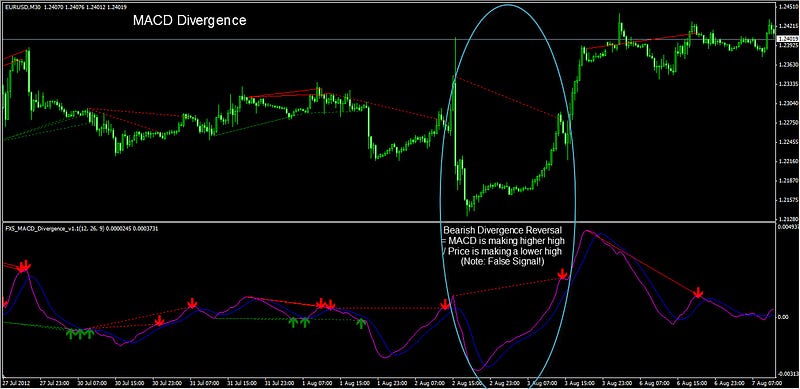
Caution: Proponents of divergences will often argue that they are more reliable than other signals, but you have to be skeptical. As the above screenshot suggests, many of the signals that were generated from divergences tended to be wrong. In order to properly determine if the divergence strategy is useful, you would need to back-test it on different pairs and across different time frames, over the last two years or more.
Conclusion
The MACD is a spin off the moving average in an attempt to reduce the problem of lag. The MACD crossing the 0 line (Strategy #1) is nothing more than the Fast (12) EMA crossing the Slow (26) EMA, and because it uses relatively shorter lengths along with the exponential calculation method, it strives to pick up the trend reversals faster than using longer lengths and simple (smoother) calculation methods. Lag is not entirely reduced, so the MACD crossing the Signal Line (Strategy #2) is an attempt to eliminate lag altogether.
The MACD line (the difference between Fast and Slow EMA) crossing over the Signal Line (9-EMA of MACD line) creates a hyper-sensitive trend changer, so much so that it seems to anticipate the trend change and become a leading instead of lagging indicator. The MACD divergence strategy (Strategy #3) is yet another way to anticipate trend change before it occurs, and so followers of MACD prefer the last two strategies because they seem ahead of the curve.
But caution goes out to all usages of MACD: in striving to reduce lag and become more of a leading indicator, it courts the risk of noise, of entering into frequent false signals generated from the up and down (trendless) vacillations of the market. Because of this problem, the MACD can never be used as a stand-alone, stop and reverse system, as it will inevitably be chopped to pieces in sideways, directionless markets.
Any back-test can quickly prove this point. MACD leading strategies can lead you into early trends sometimes, like the tip of the spear that points out the trend, but they can often lead you to the end of the spear the tip of which is hurtled back against your stop loss. Any attempt to try to lead or predict the markets will be punished with more noise and less reliability, for the chaos composition of Mr. Market will thwart any attempt to foretell its future intent.
The different MACD strategies can, however, be used as compliment conditions to for other indicator conditions, or even as act as an early trend change filter for an existing strategy. There are many robust EAs out there use the MACD, particularly strategy #2, as an additional condition or filter, so as to enter or exit the trade earlier than can be achieved from using moving averages alone.
Educate and Inspire
We hope you’ve found this information helpful and applied it to your own trading and use of crypto within the industry. By better instilling education both in technical and trading aspects to the ever evolving demographic of users, we believe that a new wave of crypto innovators, leaders and users will continue to grow. We look forward to bringing you even more development updates, news and exchange trading theory and education in the future!
Thank you for your interest in the the Latium platform. As always you can follow us on Twitter and join our Telegram Chat for the latest news, updates and developments as we progress.