In a continuing effort towards better educating the crypto user base, we present a followup to our previous story, Moving Averages: Part 2. Missed part 1? Review our past blog post below.
https://medium.com/@support_23187/trend-indicators-moving-averages-part-1-e1808564aaed
Now that we have explored some of the vulnerabilities of the moving average and proposed some fixes, we will explore some of these fixes in more detail. Basically, they deal with the length of the moving average, the calculation method, and the crossover technique.
1. Altering Lengths (and/or Time Frames) to Overcome Twin Problems of Lag and Noise
Navigating the narrow straight of length is like trying to simultaneously avoid the Scylla (6-headed sea monster) of lag, and Charybdis (whirlpool) of choppiness. The remedies for overcoming lag and noise tend to cure the one problem at the same time they bring about the side effect of the other. To overcome lag, we decrease length, which creates more noise and to overcome noise, we increase the length, which creates more lag.
First point: Decreasing length or time frame can mitigate the problem of lag.
Let us zoom into May of 2011 for the EURUSD, when the market stopped its bullish advance and turned bearish. I noticed how the 25-day period moving average did not enter into the short trend until after the market plunged 500 pips. It would have been nice to capture this trend reversal sooner than later. Could a decrease of the length catch the trend reversal sooner? Yes, it would.
Here is a screenshot of May 2011 comparing a 25-day moving average versus shorter 10-day moving average:
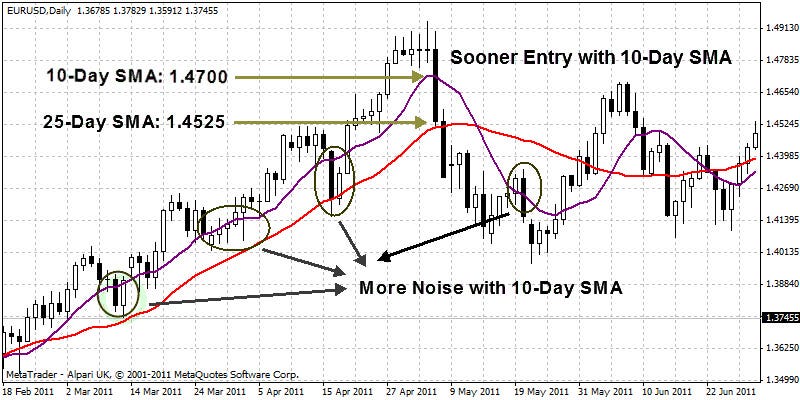
As you can see, the market crossed under the 10-Day SMA much faster, 200 pips faster, than the 25-Day SMA. That is a significant pip advantage for the faster period moving average, and thus it was successful in reducing the lag. However, it comes at a price: more noise.
If you look at the market before and after this period you will see that using this shorter 10-day SMA resulted in more false signals (highlighted in the purple circles above) from mini corrections that reverted back to the main trend. The losses from these fake-outs would have negated the 200-pip advantage, it gained picking up on the faster trend change on May 5, 2011.
Another way of reducing lag is reducing the time frame. For instance, if one wanted to get into the trend faster, one can decrease the daily period from 25 to 10, or the 10-day moving average can be translated into a 60 period moving average on H4 (6 four hour bars in 24 hrs; thus, 10X6= 60) to arrive at the same thing.
Ultimately, it is the noise in the market that undermines the performance of the moving average, and smoothness negates the noise. The foremost way to make a moving average smoother is to increase the length or time frame. A longer period average and a larger time frame both have greater smoothing effects, and thus they both carry the benefit of staying the course of the trend, avoiding the false reversals and whipsaws. If one was really noise-adverse, one would plot the moving average of this year on a 50-day moving average or a 200-day moving average.
In the world of stocks, the 50-day moving average crossing over/under the 200-day has been coined the “Golden Cross.” Here is the 50–200 MA “Golden Cross” on EURUSD H4 chart:
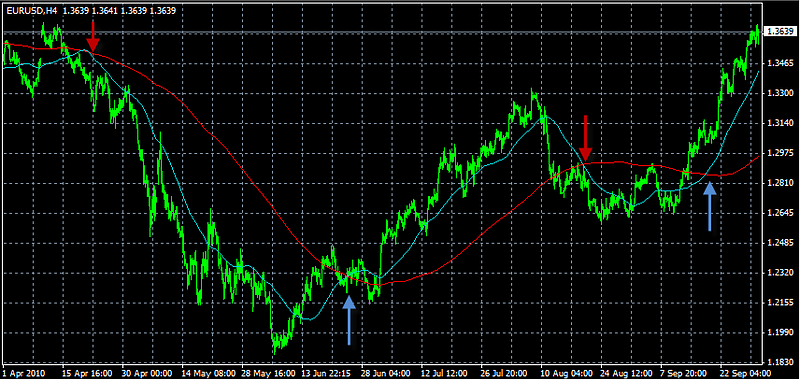
You can see in the chart above that trading the “golden crossover” on the EUR/USD H4 time frame would have generated considerable profit for 2010. One could have ridden a large downward trend from April to June and two significant upward trends from July to October 2010. The only hit you would have received would be the false short signal during August, which turned out to be a short-lived correction from the upward advance.
The problem with the longer period average is that it can extend the time it takes for a market to turn around, and by the time it turns around the move may be over. To prevent the late arrival to a bull or a bear party, traders decrease the length (or time frame) and modify the calculation method of the moving average. But, as we have seen, the problem selecting shorter lengths is opening yourself to greater noise and choppiness, more false signals that can bleed your account.
When selecting moving average length, keep in mind that the shorter the moving average, the more responsive it will be to recent movements, but the choppier it will be also. The longer the moving average, the more reliable it will be in avoiding noise, but it will be less responsive.
Selecting a moving average length is a balancing act between speed and reliability, to be short enough to respond fast enough to a trend change and at same time be long enough to avoid false trend changes (choppiness). Ultimately it is a hard decision that calls for extensive back-testing to decide on the proper length.
2. Altering the Calculation Methods to Solve the Problems of Lag and Noise
Altering the length parameter of moving averages is the foremost way of dealing with lag and noise, but there are various calculations methods that can weigh in on solving the two problems. Some calculation methods weigh in on the side of speed (to reduce lag) and others weigh in on the side of smoothness (to reduce noise).
The four major calculation methods are: simple, exponential, smoothed and weighted.
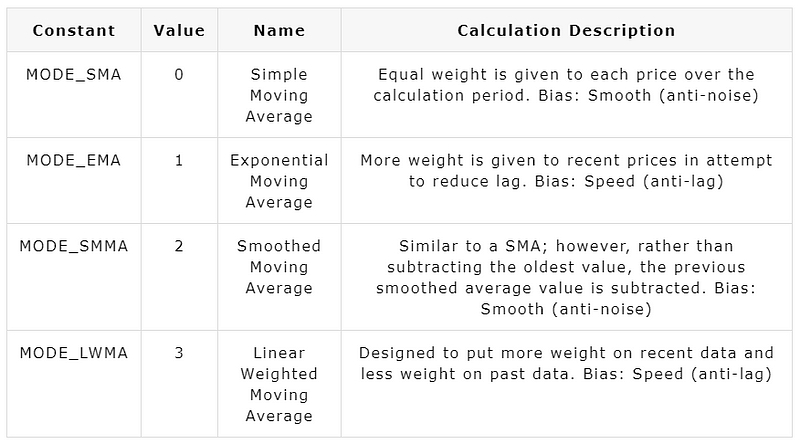
Simple Moving Average:
The most commonly used type of moving average, the simple moving average (SMA) is calculated by adding and then averaging a set of numbers representing the market. The SMA is by far the more popular mode, and it is considered highly useful because of its smoothing effect.
The formula for the SMA is as follows:
SMA = SUM (Close, N)/N
Where N – Number of Calculation Periods
It is just simple arithmetic. We all have been taught how to average in public school, measuring 10 of something, adding them up and then dividing by 10. In this case, we would be adding up the average number of 10 closing prices. The next day you add the newest close price to the total and subtract the oldest close price, keeping the total number of close prices a constant of 10.
The SMA Advantage: The SMA emphasizes smoothness, that is, it tries to smooth out the erratic behavior of the market in order to see the trend. However, there are those who do not like the fact that the SMA lags behind the latest data point by nature of its smoothing, and they prefer to give more weight to more recent data points, as in the weighted and exponential moving averages.
Exponential Moving Average:
The Exponential Moving Average (EMA) is calculated by adding the moving average of a certain share of the current closing price to the previous value.
The formula for the EMA is as follows:
EMA = (CLOSE(i)*P)+(EMA(i-1)*(1-P))
Where:
CLOSE(i) — the price of the current period closure;
EMA(i-1) — Exponentially Moving Average of the previous period closure;
P — the percentage of using the price value.
The EMA advantage: Exponential moving averages assign more meaning to the recent prices and less to the closing price from the period’s beginning. Thus it is faster at detecting a trend reversal. Naturally, and depending on the length, it can be more susceptible to market noise.
Smoothed Moving Average (SMMA):
The smoothed moving average is like a simple moving average with twice the smoothing effect. The first value of this smoothed moving average is calculated as the simple moving average (SMA):
SUM1 = SUM(CLOSE, N)
SMMA1 = SUM1/N
The second and succeeding moving averages are calculated according to this formula:
PREVSUM = SMMA(i-1) *N
SMMA(i) = (PREVSUM-SMMA(i-1)+CLOSE(i))/N
Where:
SUM1 — is the total sum of closing prices for N periods;
PREVSUM — is the smoothed sum of the previous bar;
SMMA1 — is the smoothed moving average of the first bar;
SMMA(i) — is the smoothed moving average of the current bar (except for the first one);
CLOSE(i) — is the current closing price;
N — is the smoothing period.
SMMA Advantage: The SMMA emphasizes smoothness even more so than the SMA, trying to smooth out the erratic behavior of the market in order to see the trend. You will see that the SMMA line looks like a doubling of the length of the EMA. However, the problem with the SMMA is that it could lag too far behind the price movement.
Linear Weighted Moving Average (LWMA):
Like the EMA, the latest data is of more value than more early data. A weighted moving average is calculated by multiplying each one of the closing prices within the considered series, by a certain weight coefficient.
LWMA = SUM(Close(i)*i, N)/SUM(i, N)
Where:
SUM(i, N) — is the total sum of weight coefficients.
LWMA Advantage: Like the EMA, the LWMA assigns more meaning to the recent prices and less to the closing price from the period’s beginning. Thus, they are faster at detecting a trend reversal, though they can be more prone to market noise.
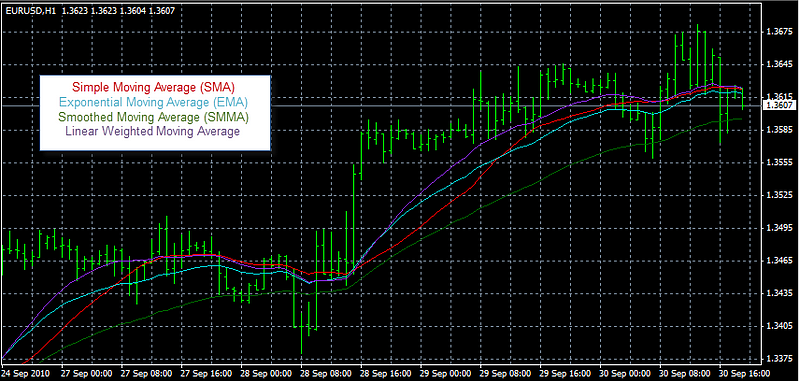
Smoothness versus speed
One way of looking at the differences in methods is to see them as a duality between smoothness and speed.
The smooth alliance is the SMA and SMMA, in that both try to smooth out the noisy, erratic behavior of the market in order to better see the underlying trend. You will see that the SMMA looks like a doubling of the length of EMA, making it the smoothest of the methods.
The advantage of smoothness, achieved by choosing these two methods and/or longer periods, is that it can see the larger trend unfold and discount the short term blips (the erratic, irregular outlier data) that occurs. However, if this one day move in price represents the beginning of a significant change in the trend, it takes longer for the underlying trend change to be discernible.
The speed alliance is the LWMA and the EMA, both seeking to overcome price lag by assigning more meaning to the recent prices and less to the older prices. In doing so, they both react to price change faster, which can be a great advantage of recent price change is legitimate but a weakness if the recent price change is due to a false blip.
Thus, the SMA and SMMA methods are slower to pick up trend changes but less likely to jump into false trend changes due to spikes or blips, and the EMA and LWMA methods are faster to pick up changes but more likely to jump into false signals. It is your choice: do you want the reliable car or the faster one?
In the end, while one may have a bias for the simple for its smoothness or the exponential for its speed, one can never know which will be the real queen of the game until both are given a fair trial.
3. Choosing the Crossover technique (Single, Dual, and Triple) as ways to deal with Lag and Noise.
Single MA Crossover
In its simplest form, called the Single Moving Average Crossover, you go long or short when the closing price crosses over/under the moving average. You buy when the closing price crosses over the moving average, and sell when it crosses under the moving average.
Here is an example of 200-MA on EURUSD H4 chart (Sept-2010 to Sept-2011):
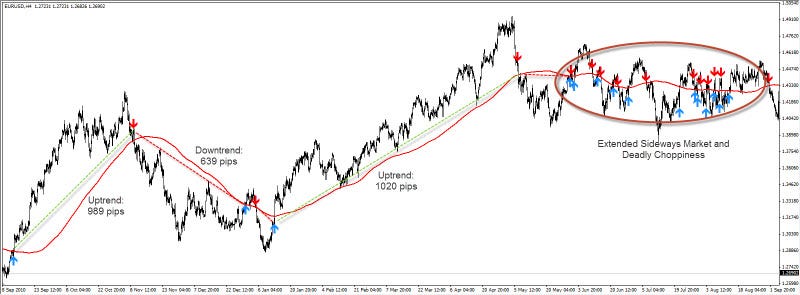
You can see that it did successfully pick up the three large downtrends (+410, +600, +460) on the EURUSD over the last year. You could have picked up these profits with the dual crossover alone without having to pay attention to the news of the debt contagion in Europe. Though it has less false trades than the single moving average, it is still vulnerable to sideways markets. The dual crossover suffered during the summer (Jun-Sept) of 2011, and it suffered in the spring (Mar-April) of 2012.
Benefits: The major benefit of the dual crossover is that it is still a relatively simple and popular trend following technique while overcoming some of the potential choppiness of the single crossover method. Because you are delaying the entry till the fast moving average cross instead of the closing price cross, you can sidestep many false cross signals.
Drawbacks: The drawback of the dual crossover is that waiting for the crossover event can delay the entry and exit. This delay can cause you to lose part or all of the move.
Triple Moving Average
The triple moving average employs three moving averages of various lengths (fast, medium and slow): when the fast moving average crosses a medium moving average, and the medium crosses a slow moving average, a bullish or bearish signal is generated depending on the direction of the crossovers.
The common moving averages used for this event are 4, 9 and 18 periods, particularly on the daily time frame (at least in the world of stocks). When the 4-day (fast MA) crosses above/below the 9-day moving average (mid MA), the event has “started”, and it is confirmed when the 9-day moving average (mid MA) crosses above/below the 18-day moving average (slow MA). A bullish signal is generated when the crossover above, and a bearish signal is generated on the crossover below.
Wait a minute, you ask: isn’t the entry trigger given when the mid-MA crosses over/under the slow MA, and thus isn’t very much like the dual crossover in that respect? Yes, that is true. There is overlap in the entry. The real difference lies in the exit. Traders use the triple moving average to more quickly exit their positions.
They exit when the fast MA crosses above/below the mid MA. While it may seem like a good idea at first, in practice it has the disadvantage of getting out of the trend too early, before it has had a chance to fully mature. It is wise to back-test this idea to see if it offers any extra edge other than the other two types of crossovers; but from experience, it seems to have offered no extra edge and often diminished the returns.
Conclusion
The moving average is perhaps the simplest of the trend following indicators, but its proper usage can be more complicated than one suspects. Again and again, we warn about the vulnerabilities of the moving average, namely its problem with lag (catching the trend too late), and its problem with noise and choppiness (catching too many false trend reversals).
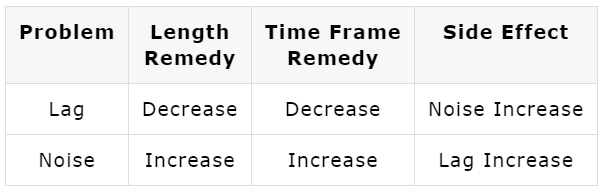
The additional problem is that lag and noise are twin problems that one needs to navigate between, and if one veers to avoid the one, one gets too close to the other. It is like trying to steer between Scylla and Charybdis, where Scylla the 6-headed sea monster represents the problem of lag (that eats away your potential pips) and Charybdis the whirlpool represents the problem of noise and choppiness (which can sink your account in a series of churning waves). Modifying the length, calculation method and crossover method are ways to steer the moving average away from one problem and closer to the other. Here is a table that sums up the dilemma:
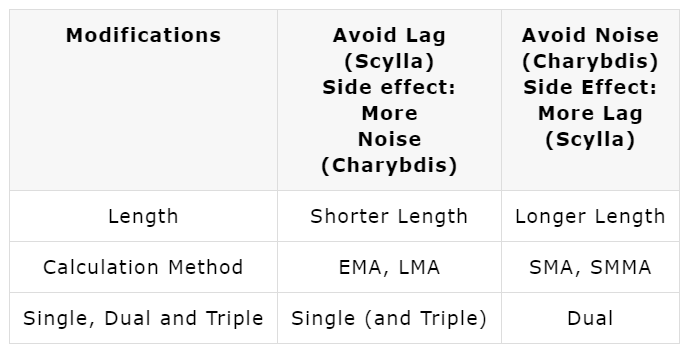
To overcome lag, we decrease length or use EMA/LMMA calculation methods or use the single (and triple) MA crossover techniques, all of which creates more noise. To overcome noise, we increase the length or use SMA/SMMA calculation methods or the dual moving average technique, all of which creates more lag.
It may be possible to find that Greek “middle way”, the balance between the two extremes: an optimized length, calculation and crossover method that is appropriately fast enough to reduce lag and yet smooth enough to reduce noise. If you can find it, the more power to you.
But if you have to make a decision between the two, it is probably better to choose, like Odysseus did, the lesser of the two evils. It is probably better to pass closer to lag of Scylla rather than noise of Charybdis, because in the end it is preferable to lose out on some potential profit (from not getting into the trend fast enough), rather than become mired in a broiling and dangerous whipsaw-whirlpool market activity that can sink all your profits. You would be better off losing a few sailors than your whole ship.
We hope you’ve found the educational content useful in your own trading and crypto usage. Many traditional trading processes apply directly to trading crypto on new and innovative exchanges, much like the Latium.org internal exchange. As we continue to expand our own platform and features, we will continue to instill education and inspiration to our users to assist. Stay tuned for more trading and news content!
Thank you for your interest in the the Latium platform. As always you can follow us on Twitter and join our Telegram Chat for the latest news, updates and developments as we progress.