Furthering Education in Crypto Trading
It is our firm belief that an educated user is a more valuable and fulfilled user, regardless of the financial industry involved. Within both traditional and crypto industries alike, furthering education of users and traders is a fruitful effort that helps the user better develop their own strategies while utilizing multiple platforms and features in their own specific crypto journey.
To continue that effort, we present the first in a series of segments that focus on specific Trend Indicators that crypto users can use to help better understand the markets they find themselves involved in.
Today we present the first part covering Moving Averages.
Trend is your Friend
One of the first things that a trader is taught is that “the trends is your friend,” and you have to “go with the flow.” This is a simple and highly popular approach which identifies the trend that is the moving average. There is probably more money both in traditional and cryptocurrencies being traded today using moving averages than with all other technical indicators combined.
Popularity is difficult to quantify, but according to a quick review into multiple trend indicator repositories available, it is the foremost popular indicator used as a basis for EA and indicator construction.
Moving Averages
Moving averages have enjoyed such popularity because they provide the clearest method to identify a trend, smoothing the erratic data to see the trend more clearly.
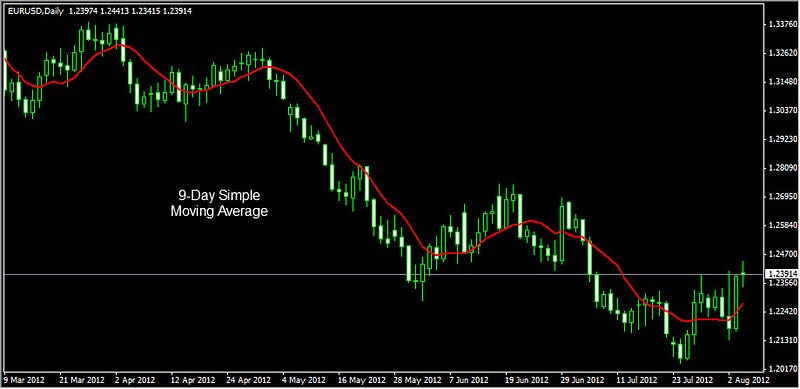
Simply put, a simple moving average is the average of a currency over a set period of time. For example, a 9-day simple moving average is the average of the last 9 day’s prices. It is calculated by taking the sum of the last 9 days of a currency’s close price and then dividing by 9. It is called simple when there is equal weight given to each price over the calculation period. Other types of moving averages are weighted averages and exponentially smoothed averages, which we will discuss later.
There are three critical parts to any moving average:
- Length (and/or Time Frame)
- Calculation Method (Simple, Exponential, Smoothed, Linear Weighted)
- Crossover Method (Simple, Dual and Triple)
We will cover each in turn, exploring the variables of each, uncovering their strengths and weaknesses. All these parts must first, however, be placed in the context of the vulnerabilities of the moving average itself (its problems with lag, noise and whipsaws), for making the choice between the different methods, lengths and crossover techniques are ways of countering these vulnerabilities.
Vulnerabilities of the Moving Average
The moving average is one of the most popular and useful indicators to depict a trend, but one should also be aware of its two inherent vulnerabilities:
- It lags the markets
- It can be subject to market noise
- It can be vulnerable to sideways and whipsaw markets
Let us show you an example of these vulnerabilities from a screenshot of a 25 daily simple moving average superimposed upon the EURUSD daily chart of 2011:
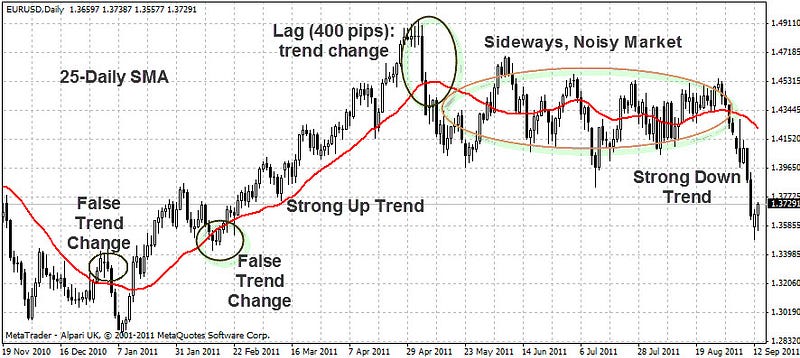
You can easily see that from Jan to May 1, 2011, the market had remained above the 25-day moving average, which means that it was in a strong uptrend. The moving average would have helped us see the trend and stay bullish on EURUSD for over five months.
That is the strength of the moving average, during that time those who followed the trend set by the moving average would have racked up significant gains.
Now let’s examine three weaknesses of the moving average over the same period.
The first weakness is that when the trend changed direction in early May, the moving average did not show this trend change till 400–500 pips later, until price crossed under the moving average at 1.4300. This is the problem of lag, which means that a significant move will have already occurred before the indicator was able to generate a signal.
The second weakness is that in the middle of February the market dipped briefly below the moving average, signaling a false trend change. You can see another false trend change occur earlier in December when the market briefly rose above the moving average. This is the problem of market noise, a term that refers to all the price data that distorts the picture of the underlying trend, such as small corrections and intraday volatility.
The third weakness can be seen from May to September 2011, where the market stayed in a sideways, very noisy, very narrow 300 pip range, with the market weaving up and down through the 25-day moving average. This is the problem of a sideways and noisy market. This sideways, noisy period would have represented significant losses for traders employing moving averages as they would have entered and been beaten up on numerous fake trend signals and subsequent stop-outs. Let us go over these three weaknesses in turn.
Weakness #1: The Problem of Lag
We have to remember that the moving average is trend-following. It can follow the trend when it is already developed but it cannot forecast a new one. In fact, it is a lagging indicator, in that it can still be rising after the price has hit resistance and crashed. In the picture above, the moving average was still rising when the EURUSD hit resistance at 1.4900 and crashed down 500 pips on May 5, 2011. You would have been able to catch some of the fall, as the price fell below the 1.4300 moving average and hit the floor of 1.3900, but it would have been nice to be able to catch more of the move from when it happened.
Fixing Lag:
There are a couple possibilities. You can reduce the length (number of days) in the moving average to make it more responsive. A shorter period moving average is more sensitive to recent prices. You can also change the calculation method, opting for an exponential or linear weighted moving average that gives more value to recent price changes.
Weakness #2: The problem of Noise
A price series with prices varying far from the moving average is said to have a lot of noise, like the static you get from a car radio when it is out of range. A moving average is designed to smooth out the erratic data so that we can better able to detect a trend.
Nevertheless, even in the best of moving averages, erratic data (in the form of volatile price spikes and short corrections) can still escape the containment of the moving average. We can see this in the picture above, in the middle of February 2011, where short-lived bearish correction caused prices to temporarily fall below the 25-daily moving average, putting some trend traders in short trades that would have ended in losses.
Numerous false trend changes of this sort entered into the picture during the summer of 2011, when the market moved in a sideways, directionless fashion with significant noise.
Fixing Noise:
There are a couple of possibilities. You can apply more days to the moving average to reduce noise. You can increase the length (number of days) in the moving average to smooth it out and make it less responsive; for instance, if you increase the days from 25 to 50, the noisy outliers become contained within the larger moving average, which makes the moving average safer to trade.
An abnormally high or low price in a 50 period moving average is less significant than in a 25 or 10 period moving average because deviant price carries less weight in the calculation.
Opting for simple or smoothed averages would also ally yourself with a form of calculating the moving averages that emphasizes the smoothness (anti-noise) factor over the speed (anti-lag) factor.
Weakness #3: The problem of a sideways market
It is exceedingly difficult for any moving average based trend following strategy to overcome the pain of a sideways market. Sideways markets usually occur after a run up or down, consolidating in a narrow range before deciding which path to take again.
The sideways EURUSD occurred during three summer months of 2011 (June, July and August), just after it fell hard in May. It was not sure if it should try to recover from the fall or keep falling. During the summer the market moved up and down through the moving average, and it would have done this up and down weaving, called a whipsaw (rapid movement of prices up and down in a volatile market, throwing up misleading signals to buy or sell at the end of the move), even if the moving average were reduced to 5 or 10, or increased to 50 or 200.
Moreover, it would have produced this sideways whipsaw activity no matter the calculation method applied to it (no matter if it was smoothed or exponential). This vulnerability represents the greatest threat to traders employing the moving average as a determinant of trend direction, as it can result in numerous losses.
Fixing Sideways Markets:
There is perhaps no sure-fire way to detect in advance the existence of a sideways market. Often it is best to follow the trend when it occurs, preparing to make the big money when it occurs 30% of the time, and also preparing yourself to survive the inevitable losses during sideways activity with sound money management.
In the sideways situation of the summer of 2011, it was possible to take the summer off and avoid the legendary choppiness of the summer. Most big money traders are on holiday during the summer, which helps explain why there is no money in the market to sustain a trend direction. Hint: Trend traders should likewise take the summer off, or at least reduce the leverage on their positions.
The only other option is to zoom in on a shorter (5 or 15 minute) time frames that may contain mini-trends. These smaller time frames are generally far too noisy for most trend traders but they might bear some fruit during a sideways market.
Stay Tuned for Part 2
Now that we have explored some of the vulnerabilities of the moving average and proposed some fixes, check back during our next segment as we will explore some of these fixes in more detail. These fixes will deal with the length of the moving average, the calculation method, and the crossover technique.
At Latium we hope to better educate and inspire our users to a more fulfilling experience within the Latium platform and ecosystem. By better educating our users, we fully believe that the ongoing process of general adoption of crypto continues to march on. Many of the concepts and trends presented here can be used within our own exchange at Latium.org, as well as a multitude of other traditional and cryptocurrency exchanges available today.
Thank you for your interest in the the Latium platform. As always you can follow us on Twitter and join our Telegram Chat for the latest news, updates and developments as we progress.